Views: 0 Author: Site Editor Publish Time: 2026-08-27 Origin: Site
This page compiles more than 40 orthopedic implant and orthopedic surgery statistics from authoritative sources including the World Health Organization, the United Nations, the OECD, the U.S. CDC, the American Academy of Orthopaedic Surgeons registries, and peer-reviewed Global Burden of Disease research. Commercial orthopedic implant market-size estimates are included separately and clearly attributed to the research firms that produced them.
Coverage spans the global orthopedic implant market, joint replacement, spine surgery, orthopedic trauma, sports medicine, and population aging. Every figure below is presented with its own data year because “2026” in this page title refers to when this resource was compiled and updated, not the year every underlying statistic was collected. Where reputable sources publish different estimates, the differences are explained rather than hidden.
Quick methodology note: This resource uses the latest reliable data from primary or authoritative sources wherever possible. Disease prevalence does not equal surgical candidacy, registry counts do not equal annual national procedure volumes, and commercial market-size figures should be interpreted as research-firm estimates. See the full methodology section for details.
These headline figures provide a quick view of market estimates, orthopedic disease burden, procedure registries, fracture burden, and demographic change. Each is explained in context later in this resource.
$52.24B
Estimated global orthopedic implant market in 2026
Fortune Business Insights
$80.44B
Forecast orthopedic implant market size by 2034
Fortune Business Insights
1.71B
People living with musculoskeletal conditions
WHO · 2019 estimate
528M
People living with osteoarthritis
WHO · 2019
365M
People with knee involvement in osteoarthritis
WHO · 2019
198 /100k
OECD average hip replacement rate
2023 data
156 /100k
OECD average knee replacement rate
2023 data
4.4M+
Hip and knee procedures analyzed in AJRR's cumulative dataset
2012–2024
466,078
Cumulative American Spine Registry procedures
Through 2024
32.5%
Share of lumbar ASR cases represented by TLIF/PLIF
2015–2024
178M
New fractures globally
GBD · 2019
1.5B+
Projected global population aged 65+
UN · 2050 projection
Global Orthopedic Implant Market Size and Growth
How Large Is the Orthopedic Implant Market?
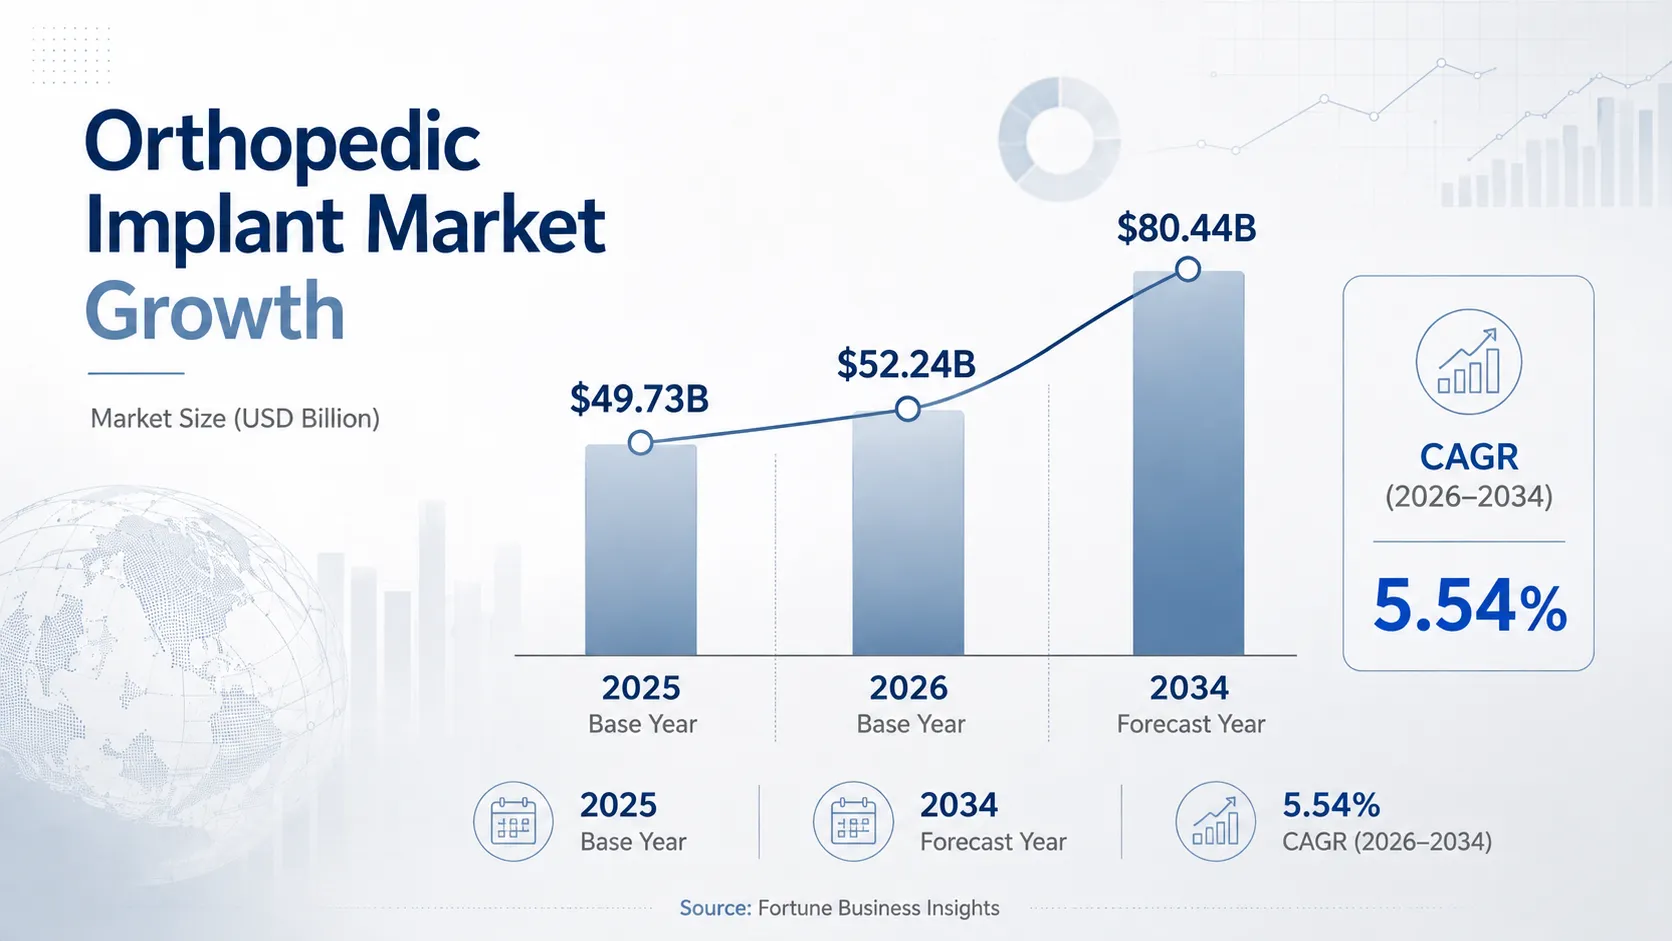
Fortune Business Insights estimates the global orthopedic implants market at approximately $52.24 billion in 2026, up from $49.73 billion in 2025. Its current forecast places the market at approximately $80.44 billion by 2034, representing a projected compound annual growth rate of 5.54% between 2026 and 2034.
These figures are commercial research estimates rather than an audited or government-reported market total. They are most useful for understanding the scale and direction of the market under a particular research methodology, not as an exact measure of every orthopedic implant sold globally.
Orthopedic implant market growth data. Source: Fortune Business Insights.
Orthopedic Implant Market Growth Forecast
Under Fortune Business Insights' model, joint reconstruction is forecast to represent approximately 46.44% of the orthopedic implant market in 2026. Hospitals and ambulatory surgery centers are projected to account for about 56.25% of end-user demand in the same model.
These estimates reinforce the commercial importance of joint reconstruction and institutional purchasing, but they should not be used to infer procedure counts directly. Market revenue reflects implant pricing, product mix, geographic differences, distribution margins, procedure availability, and other factors.
Why Orthopedic Implant Market Estimates Differ
Different market research firms publish substantially different estimates for what appears to be the same orthopedic implant market. Grand View Research estimates the market at approximately $26.97 billion in 2025, $27.95 billion in 2026, and $36.63 billion by 2033, with an estimated CAGR of 3.94%. That is considerably below Fortune Business Insights' estimate for the same general category.
Why are the numbers so different? Research firms may use different definitions of “orthopedic implants,” include different product categories, use different geographic datasets, and apply different revenue and forecasting methodologies. For this reason, a market-size figure should always be cited with the research firm that produced it rather than presented as an undisputed industry total.
Orthopedic Implant Market by Region
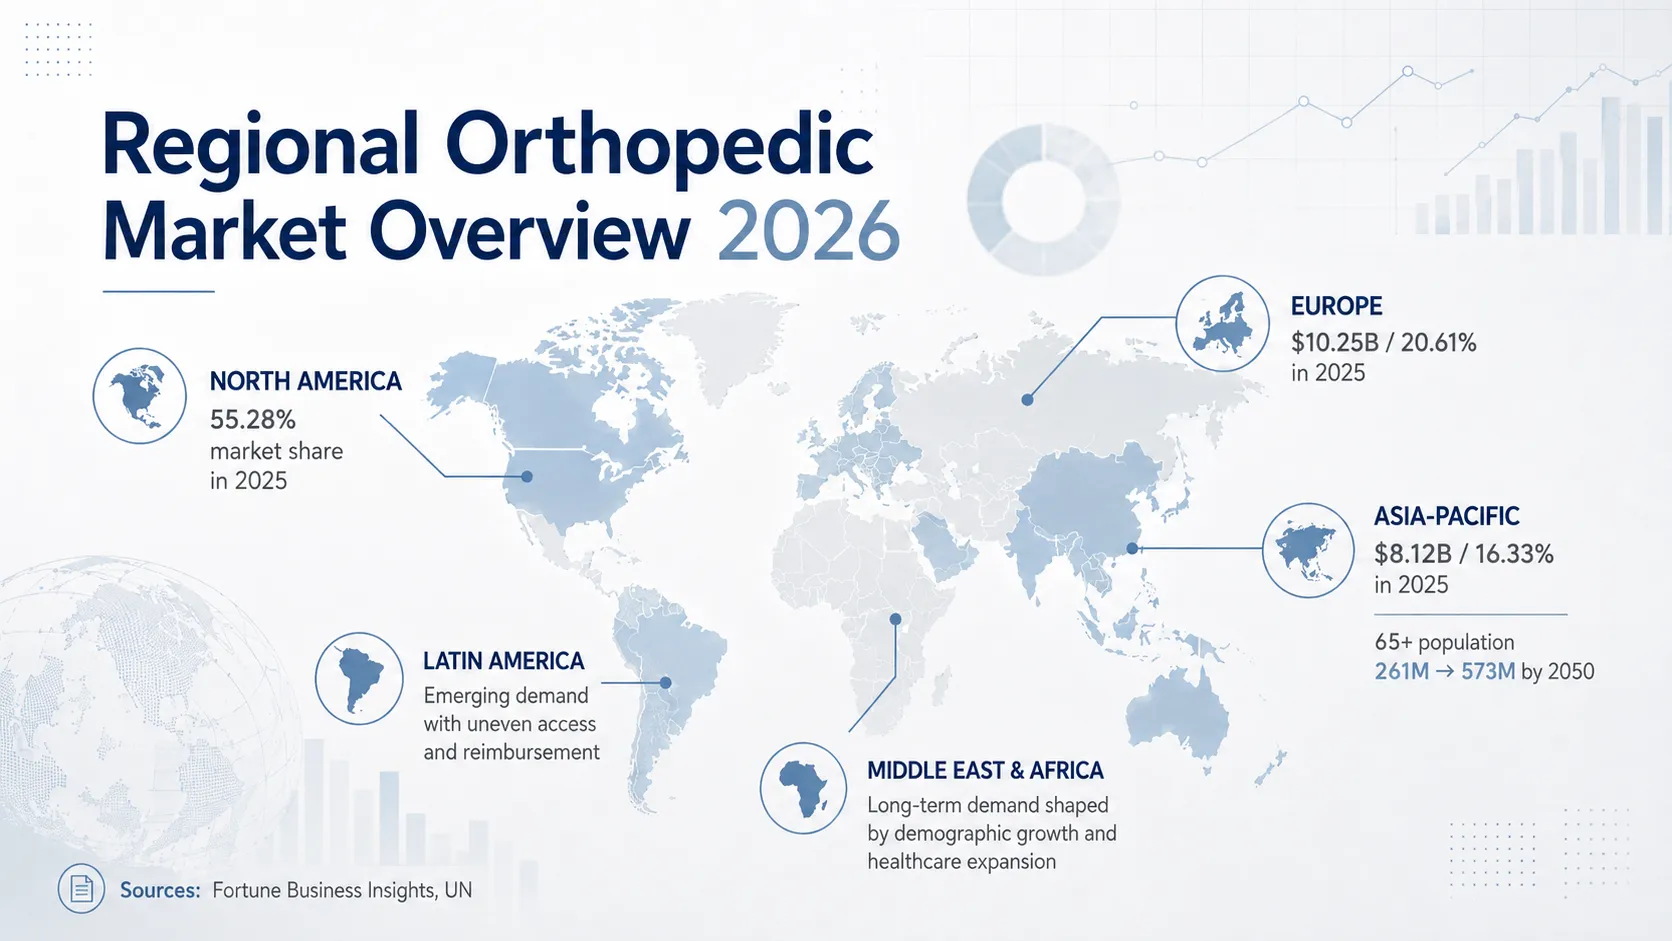
In Fortune Business Insights' 2025 estimate, North America accounted for approximately 55.28% of the global orthopedic implants market, valued at around $27.49 billion. Europe was estimated at approximately $10.25 billion, or 20.61%, while Asia Pacific was estimated at roughly $8.12 billion, or 16.33%.
Comparable same-scope figures for every global region were not available from the source set used for this resource. Rather than mix figures from incompatible market definitions, Latin America and Middle East/Africa are discussed later using demographic and healthcare context where appropriate.
Musculoskeletal Conditions Driving Orthopedic Care Demand
Global Musculoskeletal Condition Statistics
The World Health Organization estimates that approximately 1.71 billion people worldwide live with a musculoskeletal condition based on 2019 data. Musculoskeletal conditions account for around 149 million Years Lived with Disability, or approximately 17% of global YLDs.
Within this broad category, WHO's disease-burden estimates include approximately 570 million prevalent cases of low back pain, roughly 440 million people affected by fractures, and approximately 222 million cases of neck pain.
Global orthopedic disease-burden statistics. Data years vary by metric; see source sections below.
Disability Burden Does Not Equal Implant Demand
The 1.71 billion figure describes the global scale of musculoskeletal disease. It is not a count of surgical candidates and should not be interpreted as 1.71 billion potential implant recipients. Diagnosis, disease severity, conservative treatment options, clinical guidelines, healthcare access, surgical infrastructure, and reimbursement all influence whether a patient eventually undergoes an implant-based orthopedic procedure.
For market analysis, the figure is most useful as context for the healthcare environment in which orthopedic surgery and implant systems operate.
Osteoarthritis Statistics
Global Osteoarthritis Burden
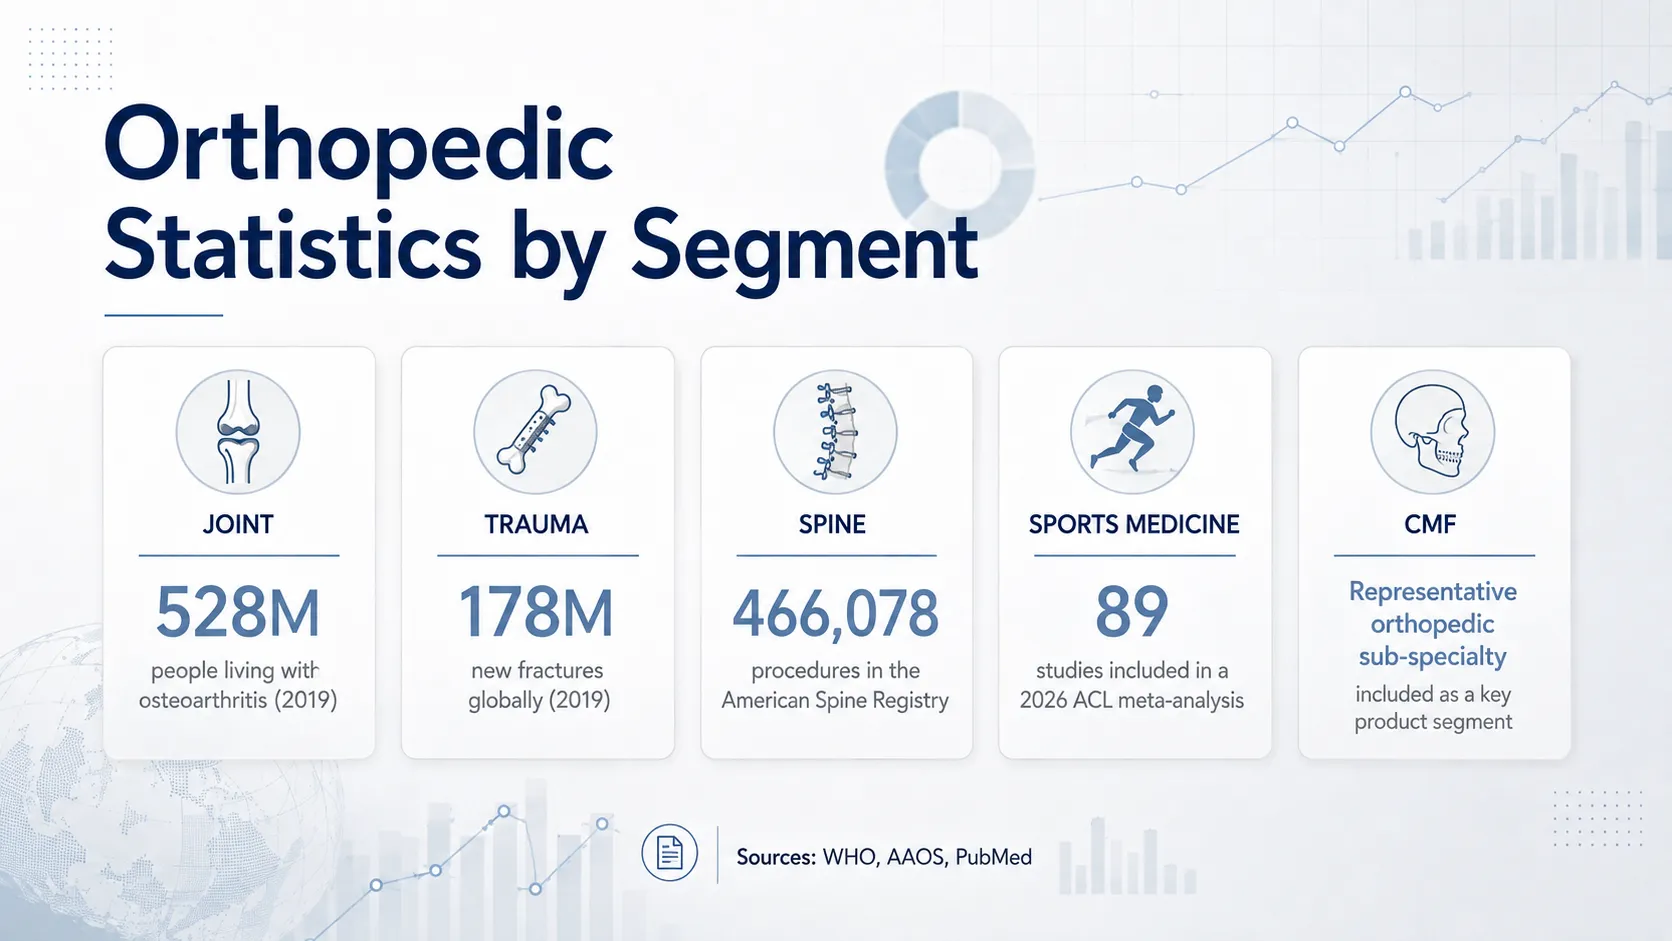
According to the WHO osteoarthritis fact sheet, approximately 528 million people were living with osteoarthritis in 2019, an increase of 113% compared with 1990. Around 73% of people with OA were aged 55 or older, and approximately 60% were female.
WHO also estimates that roughly 344 million people had moderate-to-severe osteoarthritis that could potentially benefit from rehabilitation services.
A newer Global Burden of Disease analysis estimated approximately 595 million OA cases in 2020, equivalent to around 7.6% of the global population.
The WHO 528 million estimate and GBD 595 million estimate should not be treated as contradictory. They refer to different years and reflect different modeling approaches. This resource therefore uses the WHO figure as the primary global OA statistic while using newer GBD data for supporting trends and projections.
Knee Osteoarthritis Statistics
WHO estimates that approximately 365 million people with osteoarthritis had knee involvement in 2019. A more recent GBD 2021 knee osteoarthritis analysis estimated approximately 374.7 million prevalent knee OA cases, 30.85 million new cases, and roughly 12 million associated DALYs in 2021.
Again, these figures describe slightly different reference years and modeling datasets. They are best read as consistent evidence of the large global burden of knee osteoarthritis rather than competing claims for one exact prevalence number.
Future Osteoarthritis Growth
GBD research projects that knee osteoarthritis cases could increase by approximately 74.9% between 2020 and 2050, while hip osteoarthritis cases could increase by approximately 78.6% over the same period.
These are epidemiological projections, not forecasts of knee or hip implant sales. The relationship between osteoarthritis prevalence and joint reconstruction depends on disease severity, treatment pathways, healthcare access, age, surgical eligibility, and local clinical practice.
Joint Replacement Statistics
Joint replacement statistics are especially relevant to distributors evaluating hip and knee implant systems, but national registry and OECD data must be interpreted carefully because registry participation, population coverage, and reporting methods vary.
Hip and Knee Replacement Registry Statistics
The AAOS American Joint Replacement Registry 2025 Annual Report analyzed more than 4.4 million hip and knee arthroplasty procedures with complete information collected cumulatively between 2012 and 2024. The registry covers data submitted from all 50 U.S. states, the District of Columbia, and Puerto Rico.
The report's analyzed procedure count was 8.8% higher than in the previous annual report, while the total AJRR cumulative database had exceeded 4.6 million procedures at the time of publication. The 2024 report contained approximately 3.7 million procedures through 2023.
Important interpretation AJRR's 4.4 million figure is a cumulative registry dataset spanning multiple years. It is not the number of hip and knee replacements performed in the United States in a single year. Growth in registry participation also contributes to increases in cumulative dataset size.
Hip Replacement Statistics
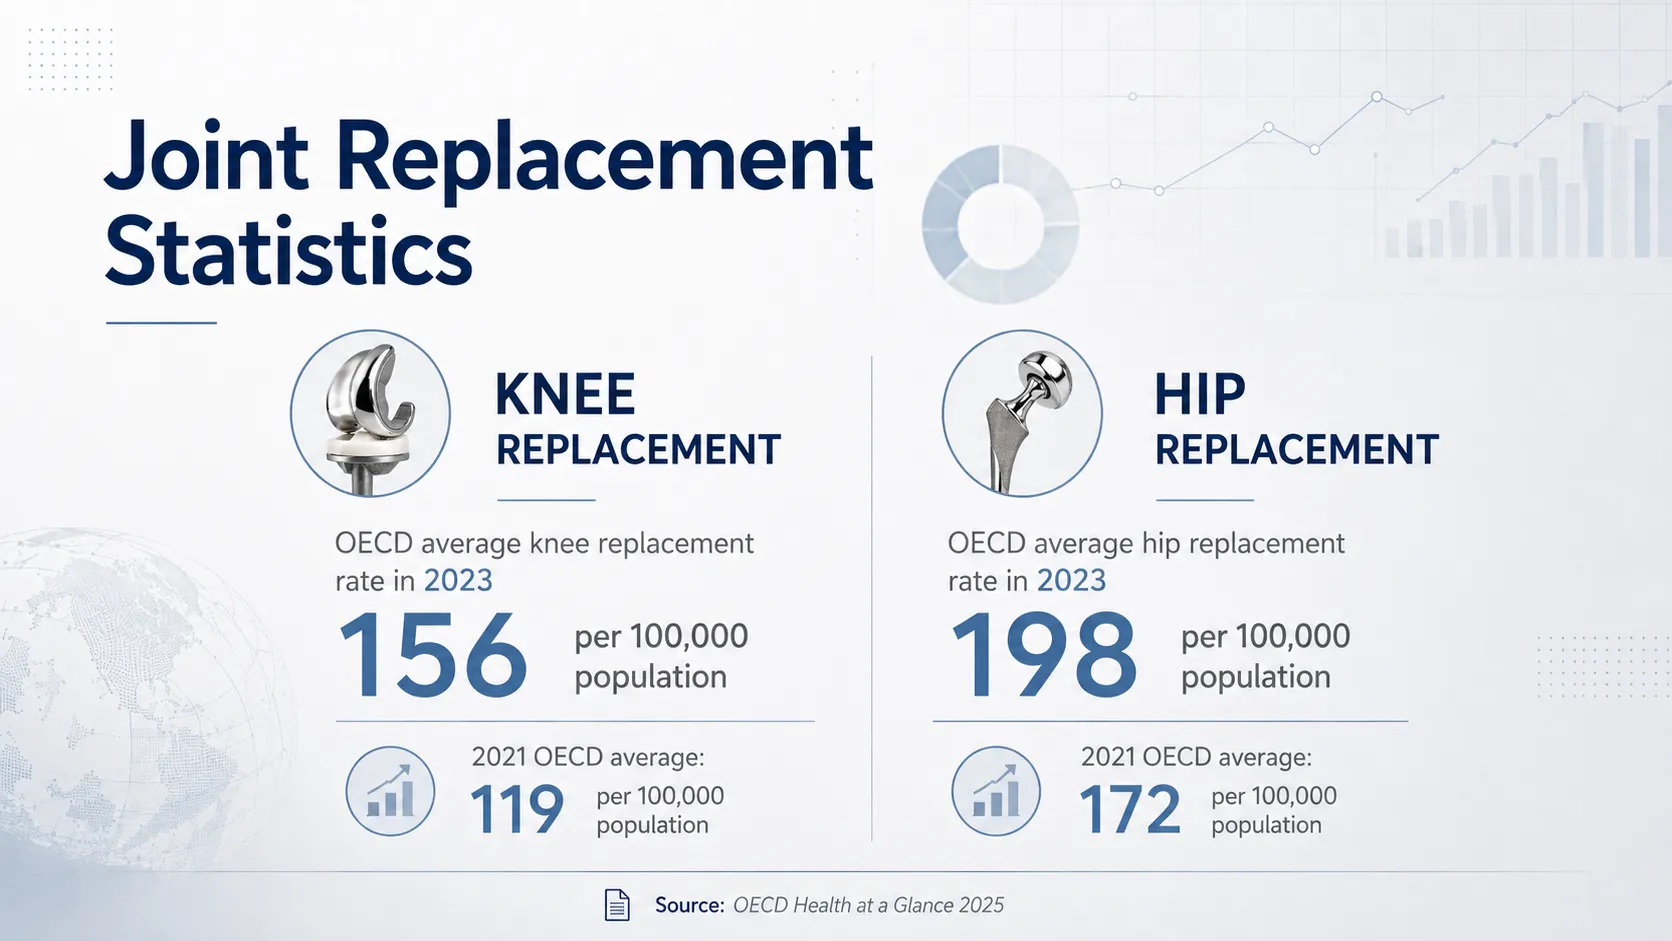
According to OECD Health at a Glance 2025, the average hip replacement rate across OECD countries was approximately 198 procedures per 100,000 population in 2023. Germany, Switzerland, Australia, Finland, and Denmark were among the countries reporting the highest rates.
The corresponding OECD average reported for 2021 was 172 per 100,000 population. The 2023 figure is higher, and OECD reporting indicates that hip replacement rates rose over the preceding decade in most member countries. However, these two figures should not be converted into a precise global growth rate because reporting coverage and datasets can change between OECD editions.
The OECD average knee replacement rate reached approximately 156 procedures per 100,000 population in 2023, compared with 119 per 100,000 in the 2021 dataset. As with the hip figures above, the comparison indicates a broader upward pattern rather than a directly calculated global annual growth rate.
The AJRR 2025 supplement includes an analysis of 101,468 unicompartmental knee arthroplasty cases, which AAOS describes as the largest UKA analysis in the registry's history.
Spine Surgery and Spinal Implant Statistics
Spine registry data can provide more procedure-specific context than headline market-size estimates. For distributors building a spine implant portfolio, procedure mix helps identify which product and instrument families deserve closer evaluation within a specific market.
American Spine Registry Procedure Statistics
The American Spine Registry 2026 Annual Report, a collaboration between AAOS and the American Association of Neurological Surgeons, reported a cumulative volume of 466,078 procedures through 2024. Registry volume was 36% higher than in the previous annual report.
As with AJRR, this is a cumulative registry dataset rather than a single-year national procedure total.
American Spine Registry procedure data through 2024. Source: AAOS/AANS American Spine Registry.
Lumbar Spine Surgery Statistics
Within the American Spine Registry's lumbar case data from 2015 through 2024, TLIF and PLIF together accounted for approximately 32.5% of recorded lumbar cases. Spinal stenosis represented approximately 60% of lumbar diagnoses in the same registry dataset.
Citation Unit
32.5%
TLIF and PLIF together represented 32.5% of lumbar cases recorded in the American Spine Registry dataset covering 2015–2024.
Source: American Spine Registry 2026 Annual Report
Cervical Spine Surgery Statistics
In the same registry dataset, ACDF accounted for approximately 62.2% of recorded cervical procedures, while spinal stenosis represented approximately 58.5% of cervical diagnoses.
These figures show that ACDF and TLIF/PLIF represent substantial shares of the cervical and lumbar cases captured by this registry. They should not be interpreted as worldwide procedure shares because registry composition and procedure patterns vary by market.
The World Health Organization estimates that approximately 619 million people experienced low back pain globally in 2020, equivalent to roughly 1 in 13 people. WHO projects the number could reach approximately 843 million by 2050.
The 2020 case count was about 60% higher than in 1990. However, WHO also notes that approximately 90% of low back pain is classified as non-specific. This is an important qualification because most non-specific low back pain is managed without spinal implant surgery.
Orthopedic Trauma and Fracture Statistics
Fracture statistics provide epidemiological context for trauma care and orthopedic trauma fixation systems, including plates, screws, intramedullary nails, and external fixation. They do not directly measure implant sales or the share of fractures treated surgically.
Global Fracture Burden
A Global Burden of Disease analysis estimated approximately 178 million new fractures globally in 2019, representing a 33.4% increase in absolute new fracture counts compared with 1990.
The same research estimated approximately 455 million prevalent fracture cases in 2019, an increase of 70.1% since 1990. Fractures accounted for approximately 25.8 million Years Lived with Disability, while total fracture-related YLDs increased approximately 65.3% over the study period.
The age-standardized fracture incidence rate was approximately 2,296.2 per 100,000 population in 2019.
Global fracture burden based on Global Burden of Disease 2019 research.
Why Total Fractures Are Rising Even When Standardized Rates Fall
The fracture dataset contains an important distinction. Although the absolute number of new fractures increased by approximately 33.4% between 1990 and 2019, the age-standardized incidence rate decreased by approximately 9.6%.
In practical terms, more fractures are occurring globally in absolute numbers even though the standardized incidence rate has declined. Population growth and changes in age structure therefore play an important role in explaining the rising absolute fracture burden.
This is more informative for long-term orthopedic planning than simply stating that “fracture risk is increasing,” which the standardized data does not support.
Fractures in Older Adults
A newer GBD 2021 analysis of fractures in older adults reported that the absolute number of new elderly fracture cases increased by approximately 134.5% over the study period. Prevalent cases increased 95.8%, while fracture-related YLDs increased approximately 90.9%.
These figures reinforce the importance of age structure when interpreting global trauma statistics, but they do not indicate what proportion of fractures required internal fixation, arthroplasty, or other surgical intervention.
Hip Fracture Statistics
Rather than repeat the widely circulated but dated “1.6 million global hip fractures annually” figure without a current primary source, this resource prioritizes U.S. CDC data.
CDC information places hip fractures in the context of approximately 300,000 hospitalizations annually among older adults following falls. Women account for roughly 70% of hip fractures treated in emergency department and hospital settings.
More detailed CDC 2019 data for Americans aged 65 and older recorded 318,797 emergency department visits, 290,130 hospitalizations, and 7,731 deaths associated with hip fractures.
Sports medicine is a narrower and more procedure-specific segment than joint reconstruction, spine, or general trauma. The statistics below are therefore used as clinical injury context rather than as a direct measure of the sports medicine implant and instrument market.
ACL Injury Statistics
A 2026 ACL injury meta-analysis reviewed 89 studies and found substantial variation in ACL injury incidence according to sport and competitive level.
Reported incidence rates included approximately 0.045 injuries per athlete-year among female semi-professional handball players, 0.027 among female professional basketball players, and 0.025 among female professional alpine skiers. These figures illustrate why a single universal ACL injury rate can be misleading.
Sex Differences in ACL Injury Risk
A separate meta-analysis of ACL injuries in team sports reported an incidence rate ratio of approximately 2.15 for female athletes compared with male athletes in the sports and studies reviewed.
Aging Population and Future Orthopedic Care Demand
Global Population Aged 65 and Older
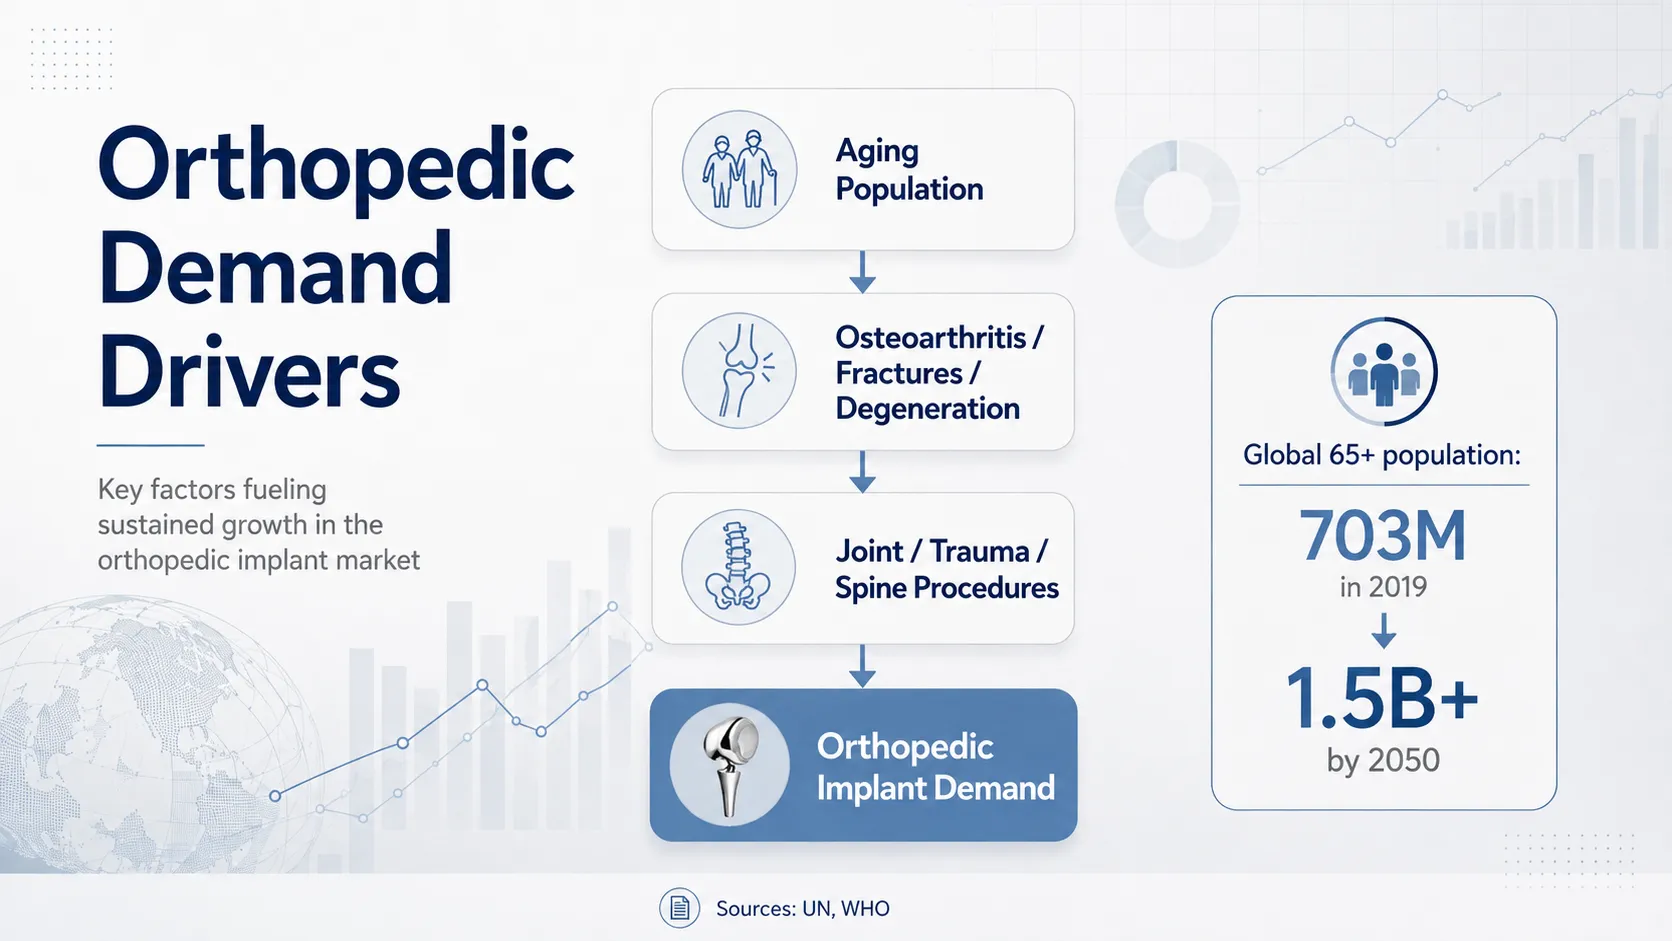
According to United Nations population aging data, approximately 703 million people worldwide were aged 65 or older in 2019, equivalent to roughly 1 in 11 people globally.
The UN projects that the global 65+ population will exceed 1.5 billion by 2050, or approximately 1 in 6 people. The population aged 80 and older is expected to roughly triple over a similar period.
Global and regional population aging trends. Source: United Nations World Population Ageing data.
Eastern and South-Eastern Asia: approximately 261 million people aged 65+ in 2019, projected to reach 573 million by 2050.
Northern Africa and Western Asia: approximately 29 million to 96 million, an increase of about 226%.
Sub-Saharan Africa: approximately 32 million to 101 million, an increase of about 218%.
These demographic shifts may contribute to higher long-term orthopedic care needs, but population aging alone does not determine implant demand. Procedure volume also depends on healthcare access, reimbursement, hospital infrastructure, surgeon availability, regulatory pathways, and local treatment practices.
Orthopedic Implant Market Statistics by Region
North America
North America represented approximately 55.28% of the global orthopedic implants market in Fortune Business Insights' 2025 estimate, corresponding to around $27.49 billion. The region also has relatively mature orthopedic registry infrastructure through systems such as AJRR and the American Spine Registry.
Market size and registry depth should still be treated as separate indicators. Registry coverage helps describe procedures and outcomes, while commercial market-size estimates attempt to model revenue.
Europe
Europe was estimated at approximately $10.25 billion, or 20.61% of the global market, under the same Fortune Business Insights methodology. OECD data also places several European countries, including Germany and Switzerland, among countries with comparatively high hip and knee replacement rates.
Asia Pacific
Asia Pacific was estimated at approximately $8.12 billion, or 16.33% of the global market in the 2025 Fortune estimate. At the same time, Eastern and South-Eastern Asia's population aged 65 and older is projected to more than double by 2050.
These two datasets describe different dimensions of the region: current modeled market revenue and long-term demographic change. Rapid population aging does not necessarily imply equally rapid growth in orthopedic procedure volume.
Latin America
This resource does not cite a Latin America market-size number because a directly comparable same-scope figure was not available in the prioritized source set. For distributors, country-level healthcare access, import structures, product registration pathways, surgeon networks, and procedure mix may be more useful than combining very different national markets into one unsupported regional total.
Middle East and Africa
A directly comparable orthopedic implant market-size estimate is likewise not used here. What is well documented is the demographic trend: the population aged 65 and older is projected to grow substantially across Northern Africa, Western Asia, and Sub-Saharan Africa.
This aging trend is relevant to long-term orthopedic healthcare planning, but it is not a proxy for near-term implant sales because surgical infrastructure, reimbursement, regulatory systems, and access to specialty orthopedic care differ widely across markets.
What These Orthopedic Implant Statistics Mean for Distributors
Evaluate Joint, Spine and Trauma as Distinct Demand Pools
Joint reconstruction, spine surgery, and fracture fixation are all substantial areas of orthopedic care, but their demand drivers are different. Joint reconstruction is closely connected with osteoarthritis and population aging. Spine demand depends heavily on procedure-specific indications and treatment pathways. Trauma is influenced by fracture burden, age, injury patterns, and emergency-care infrastructure.
For distributors, these categories are therefore more useful when evaluated as separate demand pools than when treated as one undifferentiated “orthopedic market.”
Procedure Mix Can Be More Useful Than Headline Market CAGR
A headline market-growth figure may help establish category scale, but it does not tell a distributor which implant families or instrument sets deserve closer attention. Procedure-mix information such as the American Spine Registry's TLIF/PLIF and ACDF shares provides more specific context for portfolio evaluation.
The appropriate conclusion is not that a particular procedure will generate the most sales in every country. Rather, registry data can help identify procedure categories that warrant deeper local evaluation when planning a spine product and instrument portfolio.
Aging Does Not Create Uniform Demand
The fastest-aging regions do not necessarily become the fastest-growing implant markets at the same rate. Healthcare funding, surgical capacity, registration requirements, surgeon training, private-versus-public hospital structure, and reimbursement all affect how demographic pressure translates into actual procedure volume.
Implant and Instrument Supply Should Be Evaluated Together
Orthopedic procedures depend on matched instrumentation as well as implants. For this reason, distributors evaluating joint reconstruction systems, spine systems, or trauma systems should review implant range, surgical instrument compatibility, replenishment, regulatory documentation, and procedure coverage as one connected supply program.
Methodology and Data Sources
Latest available data. “2026” in the title refers to when this resource was compiled and last updated. Individual metrics use the latest reliable data available when this page was prepared, and the underlying data year is identified wherever relevant.
Original sources preferred. Government bodies, international organizations, clinical registries, and peer-reviewed studies are prioritized over secondary summaries. WHO, UN, OECD, CDC, AAOS registries, and peer-reviewed GBD research are cited directly.
Commercial market research is treated as an estimate. Market-size and forecast figures from organizations such as Fortune Business Insights and Grand View Research are explicitly attributed to those firms. Their estimates can differ substantially because of scope and methodology.
Registry data does not equal annual national volume. AJRR's 4.4M+ procedures and the American Spine Registry's 466,078 procedures are cumulative multi-year registry datasets. They should not be reported as annual national procedure totals.
Clinical burden does not equal implant demand. Disease and fracture prevalence figures describe population health burden. They do not identify surgical candidates, implant recipients, or product sales volume.
Frequently Asked Questions
How large is the orthopedic implant market in 2026?
Fortune Business Insights estimates the global orthopedic implants market at approximately $52.24 billion in 2026. Grand View Research estimates approximately $27.95 billion for the same year. The difference reflects variations in product scope, datasets, and forecasting methodology, so market-size figures should always be attributed to their source.
How fast is the orthopedic implant market growing?
Fortune Business Insights forecasts a CAGR of approximately 5.54% from 2026 to 2034, while Grand View Research estimates approximately 3.94% over its forecast period. These are modeled forecasts rather than audited historical growth rates.
How many people have musculoskeletal conditions worldwide?
WHO estimates that approximately 1.71 billion people globally live with a musculoskeletal condition based on 2019 data. These conditions account for roughly 17% of global Years Lived with Disability.
How many knee replacements are performed?
A reliable cross-country comparison is the OECD average knee replacement rate of approximately 156 procedures per 100,000 population in 2023. This is an OECD-country average rather than a global annual procedure total.
How many hip replacements are performed?
OECD data reports an average hip replacement rate of approximately 198 procedures per 100,000 population across OECD countries in 2023. Rates vary substantially between countries.
What share of lumbar and cervical registry cases do TLIF/PLIF and ACDF represent?
In American Spine Registry data covering 2015–2024, TLIF and PLIF together represented approximately 32.5% of recorded lumbar cases, while ACDF accounted for approximately 62.2% of recorded cervical procedures. These percentages describe this registry dataset and should not be treated as worldwide procedure shares.
What factors influence orthopedic implant demand?
Relevant long-term factors include musculoskeletal disease burden, osteoarthritis, fractures, population aging, surgical access, hospital infrastructure, reimbursement, surgeon availability, regulatory pathways, and procedure mix. No single epidemiological statistic can be converted directly into implant sales.
Cite This Resource
If you use an individual statistic from this page in research, editorial content, or industry analysis, please cite the original organization or study responsible for the underlying figure. When referencing XC Medico's compilation, comparison, or interpretation of multiple datasets, link to this page as the research resource.
Data Sources and References
The following primary and authoritative sources support the principal statistics used in this resource.
Use procedure demand, product-system compatibility, instrument requirements, registration needs, and local market conditions together when evaluating an orthopedic supply program. XC Medico supports distributors across trauma, spine, joint reconstruction, sports medicine, and matched surgical instruments.
As a globally trusted Orthopedic Implants Manufacturer, XC Medico specializes in providing high quality medical solutions, including Trauma, Spine, Joint Reconstruction, and Sports Medicine implants. With over 19 years of expertise and ISO 13485 certification, we are dedicated to supplying precision engineered surgical instruments and implants to distributors, hospitals, and OEM/ODM partners worldwide.